It’s a thorny problem. Charities needing to demonstrate that they are economic, efficient and effective and committed to supporting their beneficiaries with a sizeable proportion of their income each year. At the same time, trying to invest in sufficient operating resources (staff, in particular) to enable them to grow and deliver more from the funds they are entrusted to nurture and administer.
Two questions often arise:
- How can a charity demonstrate its performance?
- What proportion of its operating expenditure should a charity spend on activities other than directly supporting beneficiaries?
Demonstrating performance
The Institute of Fundraising has identified the wide range of ways in which established charities seek to demonstrate their performance year on year. This includes:
- income generation
- fund growth
- number of activities specifically targeted at potential donors/funders, e.g. campaigns, marketing, meetings, applications, calls, event invites etc.
- retention of existing donors, funders and partnerships
- wins/generation of new donors, funders and partnerships
- value of pledged income
- quality of ‘pipeline’ prospects and success/conversion rates
- average size of donations
- feedback from supporters
- some measurement of the return on investment (ROI).
Focusing purely on income generation and/or fund growth is a crude, but easily understandable, measure of performance. But it can never present a full and balanced picture of organisational performance and all the added value that is delivered by a charity.
Proxy measures for activities likely to generate philanthropic giving – such as campaigns, meetings and marketing – can be useful in monitoring whether a charity is doing as much as it can each year to maintain existing funding streams and bring in new sources of money. But simply having a frenetic programme of activities cannot guarantee that the charity will be able to maintain a healthy income stream or generate any greater enthusiasm for philanthropy. It is a question of belief, rather than science, that one will lead inexorably to the other. What is needed is a targeted programme of activities in areas likely to generate the biggest return on the investment of time and resources.
Examining the average size of donations each year can provide some measure for the types of donors and philanthropists a charity is attracting. This can be extremely useful if the charity is looking to move from reliance on a programme of traditional ‘fundraising’ (where the income stream may be derived from lots of small amounts of money) towards one focused on ‘fund development’ (with fewer, but larger, sums of money involved). Strategies based around the latter are usually predicated on the assumption that this will provide a greater financial return for the investment of the charity’s limited time and resources. Some care needs to be taken with such measures, however, as the performance figures can be skewed by the choice of average used, i.e. the mean (arithmetic calculated average), median (mid-point figure in an ascending scale of donations received) or modal average (the most popular or frequently given amount of money).
Alongside the above, many established charities are now focusing far more of their time in demonstrating the impact of their activities on the beneficiaries they support – assembling evidence of the outputs and outcomes from their operational work. There is a simple logic to this, which often plays out well in terms of communicating this performance to those who have supported the charity – “This is what you gave us – this is what we delivered as a result.”

Return on investment
Measuring some form of ‘Return on Investment’ (ROI) is occasionally used by charities to demonstrate both their performance and impact. But as with other measures of success, it is not an exact science and does not present a full picture of performance. Care also needs to be taken in selecting the best ratio to use. The simplest to apply is the ‘General Ratio’, which simply measures the value of all income against the charity’s expenditure, and is expressed in terms of the amount of income generated for every £1 spent. Figures produced by the National Council for Voluntary Organisations (NCVO) as part of its ‘UK Civil Society Almanac’ show that the average amount of income generated by charities over the past decade has been consistently around £4 to £5 for every £1 spent.
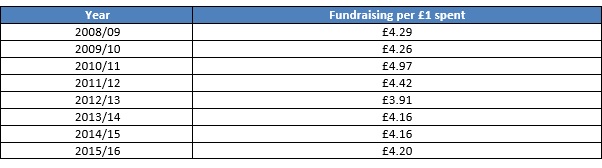
A more useful measure of performance is the NCVO ‘Almanac Fundraising Ratio’, which is calculated in the following way:
(Voluntary income plus earned income from all activities for raising funds)
divided by
(spending on raising funds minus the cost of managing investments)
On the basis of this ratio, the average annual performance of charities has been as follows:
The ROI approach can also be used to measure the value added by all of the fundraising activities of a charity and help in determining what might be an optimal level of investment in some of the other activities which support beneficiaries. This is discussed in the section below.
Determining an optimal level of investment in ‘other activities’
A well-run, highly-regarded charity – that is delivering against all of its charitable objectives – could argue that every penny of its annual budgeted expenditure is there to support beneficiaries. Delivering sustained community investment – in terms of ongoing funding, grants and volunteering support – requires:
- good governance
- strong leadership
- excellent administration
- the capacity, skills and commitment to foster philanthropic giving, year in, year out.
There should be no debate about whether these ‘other activities’ are needed. The regulatory framework for charities demands that these building blocks are put into place. But in an operating environment where the trust and faith in some established charities has been called into question in recent years, it is not unreasonable for those contemplating some form of charitable giving to ask questions about the proportion of expenditure spent on these activities and the value that they add in delivering support to beneficiaries.
There is a school of thought which says that charities should be passing on to beneficiaries virtually all of their voluntary income each year while retaining the leanest and most economical administrative structure. In support of this, it is often claimed that this is what the general public wants and expects to see. However, a survey conducted in 2016 by the non-profit research agency NfpSynergy, challenges this assumption. Its According to the Public survey asked 1,000 adults in the UK to give their views on ideal charity spending. The results showed that the public are happy for a charity to spend an average of 14% of its income on each of the following – ‘campaigning’, ‘fundraising’ and ‘running costs’, with the remaining 58% being spent ideally on ‘helping beneficiaries’.
It is further claimed that the public are more likely to give to charities which spend comparatively less on the costs of their administration or ‘running costs’. This is, again, not borne out by research. The charity Giving Evidence – which works to enable giving based on sound evidence – compared the amount spent by 265 charities on the costs of their administration. Working with the non-profit agency Givewell – which publishes research on ‘Recommended Charities’ to help donors decide where to give – the results demonstrated that there was virtually no difference between the average proportion of spend on administration in recommended charities (£11.5%) and the amount spent on overheads by charities that Givewell did not feel confident to recommend (10.8%). Caroline Fiennes, Director of Giving Evidence, said in the research report: “Assessing a charity by its administrative spend is like assessing a teacher on how much chalk they use, or assessing a doctor on how many drugs they prescribe. They’re easy measures, but they don’t relate to performance.”
A frequent area of debate is the amount that charities spend each year on activities to raise more money. Yet the most recent statistics produced by the UK Civil Society Almanac show that charities spend an average of only 12.9% of their annual budget on activities to raise more money (less than the ‘14%’ ideal cited above).
This still leaves us with the challenge of determining an optimal level of spend on both ‘campaigning’ and ‘fundraising’. While the ‘Almanac Fundraising Ratio’ can be used to measure a charity’s overall level of performance, it is possible to focus more specifically on the added value delivered by the individual activities which help charities to raise money each year. The Institute of Fundraising calls this the ‘Voluntary Income Ratio’. It measures the voluntary income per £1 invested by charities. Figures for 2014 (the most up to date available) show the average performance of charities across the full range of campaigning and fundraising activities:
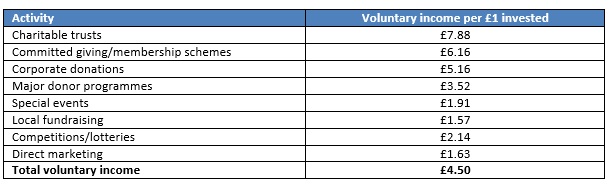
The figures can be used to benchmark a charity’s performance in these areas and the added value of different campaigning and fundraising activities, e.g. for the investment of a charity’s limited time and resources, it is quite clear that ‘committed giving/membership schemes’ and ‘corporate donations’ deliver a much better ROI than ‘direct marketing’ or ‘local fundraising’.
The figures could also be used in a general sense to determine an optimal level of spend on campaigning and fundraising activities, although the wide variety and nature of different charities would suggest that extreme caution needs to be taken here. For example, the operating model for an organisation raising funds in perpetuity for a wide range of charitable causes is likely to be very different to that in a single-interest charity which is set up to raise funds for a short-term disaster-relief appeal.
